Shodan Command-Line Interface
The shodan command-line interface is packaged with the official Python library for Shodan, which means if you’re running the latest version of the library you already have access to the CLI.
Installation
In a virtual python environment like pyenv:
If you have python installed then you can use this command:
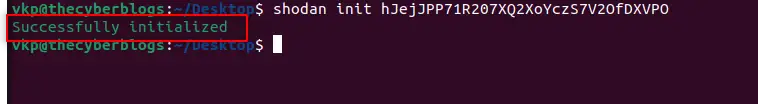
Once the tool is installed it has to be initialized with your API key:
Visit https://account.shodan.io to retrieve the API key for your account.
You will get a message of successfully initialized if you have done everything correctly.
Shodan help menu
You can view shodan help menu by this command :
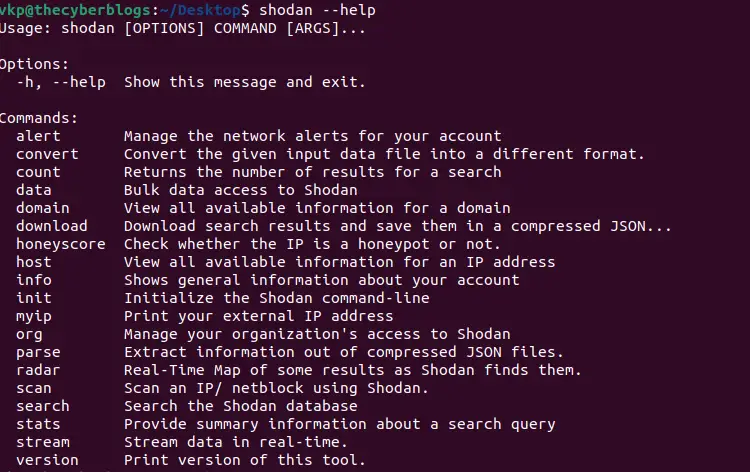
There are many options available in shodan cli mode like alert, convert, count, data, domain and etc.
Shodan options
alert
The alert command provides you the ability to create, list, clear and remove network alerts.
convert
Convert the compressed JSON file generated by Shodan into a different file format. At the moment
it supports output to kml and csv.
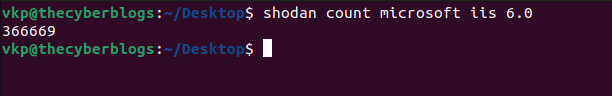
count
Returns the number of results for a search query.
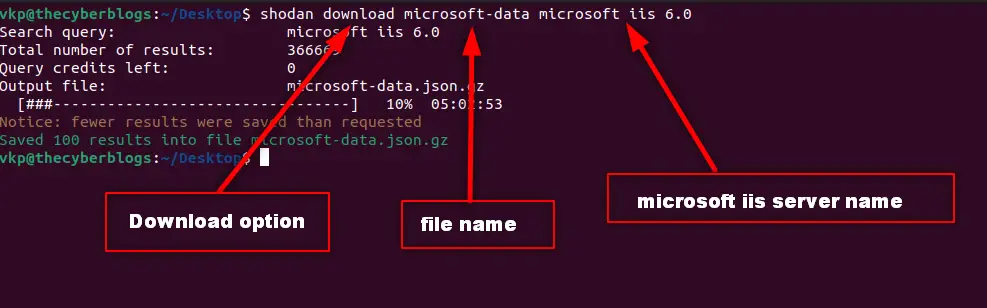
download
Search Shodan and download the results into a file where each line is a JSON banner .By default it will only download 1,000 results, if you want to download more look at the –limit flag.
The download command is what you should be using most often when getting results from Shodan since it lets you save the results and process them afterwards using the parse command. Because paging through results uses query credits, it makes sense to always store searches that you’re doing so you won’t need to use query credits for a search you already did in the past.
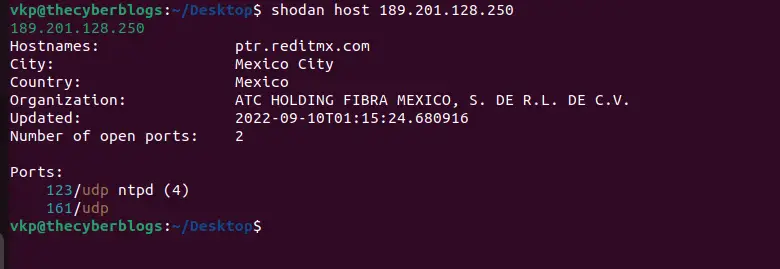
host
See information about the host such as where it’s located, what ports are open and which organization owns the IP.
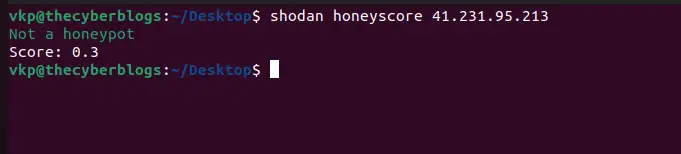
honeyscore
Check whether an IP address is a honeypot pretending to be an industrial control system.
info
Obtain general information about your API plan, including how many query and scan credits you have remaining this month.

myip
Returns your Internet-facing IP address.

parse
Use parse to analyze a file that was generated using the download command. It lets you filter out the fields that you’re interested in, convert the JSON to a CSV and is friendly for pipe-ing to other scripts.
The following command outputs the IP address, port and organization in CSV format for the previously downloaded Microsoft-IIS data:

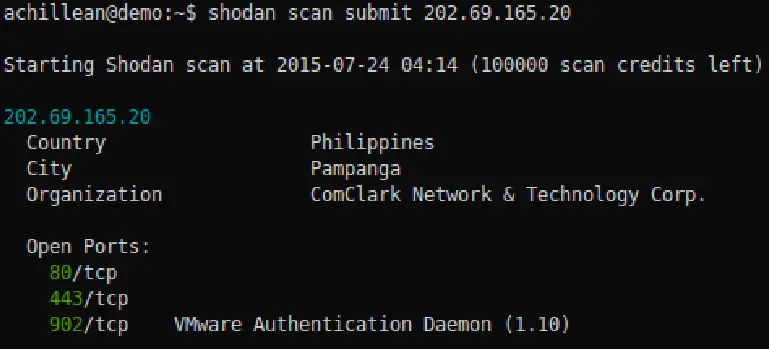
scan
The scan command provides a few sub-commands but the most important one is submit which lets you perform network scans using Shodan.
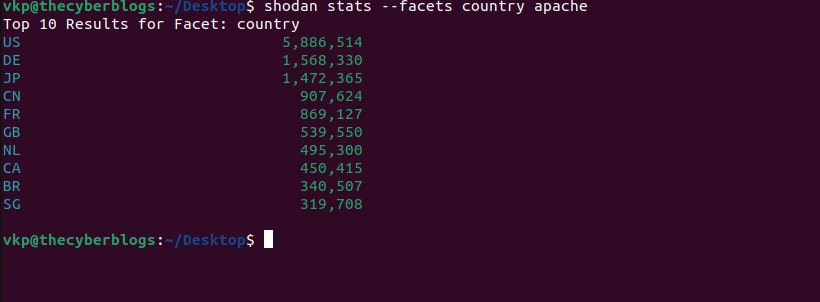
stats
The stats command lets you print the facets for a search query.
For example, the following command shows the most popular countries where Apache web servers are located in:
search
This command lets you search Shodan and view the results in a terminal-friendly way. By default it will display the IP, port, hostnames and data. You can use the –fields parameter to print whichever banner fields you’re interested in.
For example, to search Microsoft IIS 6.0 and print out their IP, port, organization and hostnames use the following command:

stream
The stream command provides access to the real-time stream of data that the Shodan crawlers collect.
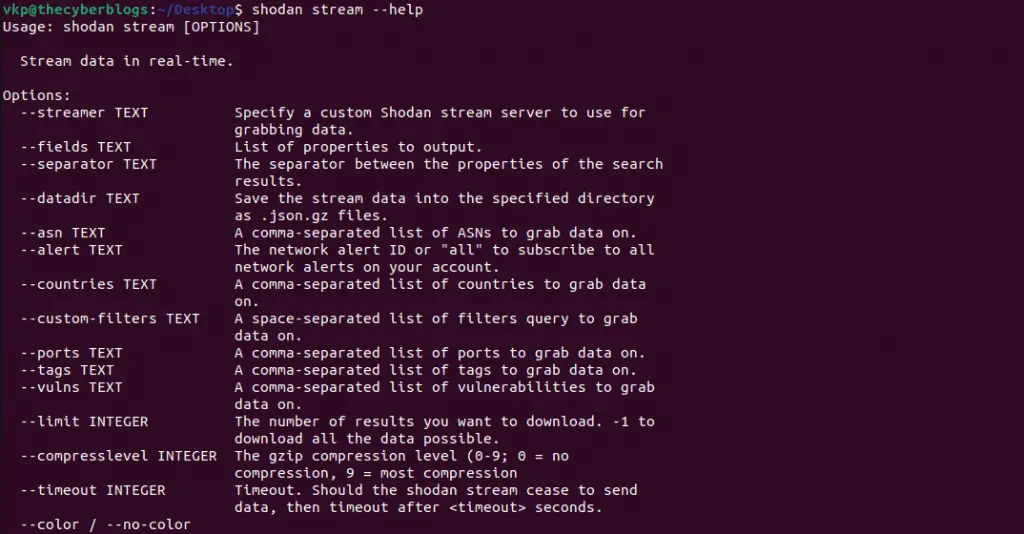
–datadir
The –datadir flag lets you specify a directory in which the streamed data should be stored. The files generated in the –datadir directory have the following naming convention:
–limit
A sample file name would be “2016-01-15.json.gz”. Each day a new file is automatically generated as long as you keep the stream running. For example, the following command downloads all the data from the real-time stream and saves it in a directory called /var/lib/shodan/:
–ports
The –ports flag accepts a comma-separated list of ports to let you stream only records gathered from those ports. The following command prints out a stream of banners that were collected from services running on port 80 or 8080:
Example: Network Analysis
The most common use-case for Shodan is using it to get a better picture of what’s running on your public network range. The shodan command-line tool can help you get a quick idea of what you’re dealing with. For the purpose of this example we will take a look at the range of your subnet. To get started lets see how many services are exposed to the Internet:
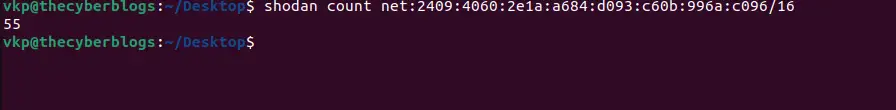
The count command will provide us the total number of banners that Shodan has gathered for your subnet. At the moment of writing this turns out to be 4,363 results. The count gives us an idea of how big the public network surface is for the organization but it doesn’t give much insight into whether the exposed services are intended to be that way or not. As such, the next step is to get a breakdown of the open ports on the network:

Example: Telnet Research
Lets assume we want to perform research into devices on the Internet running Telnet. As a starting point we can combine all of the aforementioned commands into the following:
we request 10,000 records (–limit 10000) from the stream on common Telnet ports (–ports 23,1023,2323) and store the results